Change Language :
iglidur® UW - material data
Material data table
General properties
Unit
iglidur® UW
Testing method
Density
g/cm³
1.52
Colour
black
Max. moisture absorption at +23°C/50% room humidity
% weight
0.2
DIN 53495
Max. water absorption3)
% weight
0.8
Coefficient of sliding friction, dynamic against steel
μ
0.15-0.35
pv value, max. (dry)
MPa x m/s
0.11
Mechanical properties
Flexural modulus
MPa
9,600
DIN 53457
Flexural strength at 20°C
MPa
90
DIN 53452
Compressive strength
MPa
70
Maximum recommended surface pressure (20°C)
MPa
40
Shore D hardness
78
DIN 53505
Physical and thermal properties
Max. long-term application temperature
°C
+90
Max. short-term application temperature
°C
+110
Min. application temperature
°C
-50
Thermal conductivity
W/m x K
0.60
ASTM C 177
Coefficient of thermal expansion (at 23°C)
K-1 x 10⁻⁵
6
DIN 53752
Electrical specifications2)
Specific transitional resistance
Ωcm
<105
DIN IEC 93
Surface resistance
Ω
<105
DIN 53482
- Under certain circumstances, the good conductivity of this plastic can favour the generation of corrosion on the metallic contact components.
- With regard to the application of the material in direct contact with water, it must be pointed out that all results were obtained under laboratory conditions using DI water (deionised water). We therefore recommend application-specific tests under real conditions of use.
Table 01: Material data
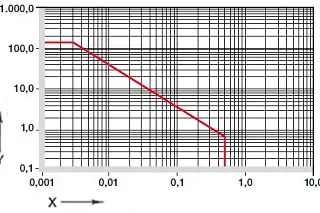
Diagram 01: Permissible pv values for iglidur® UW plain bearing with a wall thickness of 1mm in dry operation against a steel shaft at +20°C, mounted in a steel housing
X = Surface speed [m/s]
Y = Load [MPa]
iglidur® UW was developed for underwater applications in which the maximum temperatures are significantly lower than +100°C. For application temperatures above this limit, the plain bearings made from iglidur® UW500 are available. Although iglidur® UW was developed for application in liquids, it is also suitable for dry operation. This is particularly important in applications that are used in both dry and wet operations, which is often encountered in practice. Unless specifically stated otherwise, the specifications of the bearings made from iglidur® UW described in this section apply to the dry operation.

Diagram. 02: Maximum recommended surface pressure as a function of temperature (50MPa at +20°C)
X = Temperature [°C]
Y = Load [MPa]
Mechanical specifications
The maximum recommended surface pressure represents mechanical material parameter. No conclusions regarding the tribological properties can be drawn from this. With increasing temperatures, the compressive strength of iglidur® UW plain bearings decreases. Picture 02 shows this relationship.

Diagram 03: Deformation under pressure and temperature
X = Load [MPa]
Y = Deformation [%]
Diagram 03 shows the elastic deformation of iglidur® UW at radial loads. At the maximum recommended surface pressure of 40MPa, the deformation is less than 1%.

Diagram 04: Coefficient of friction as a function of the surface speed, p = 0.75MPa
X = Surface speed [m/s]
Y = Coefficient of friction μ
Friction and wear
The surface finish of the shafts should not be too smooth so as to prevent a high adhesion effect and a related increase in the coefficient of friction. Please contact us for the specifications of shaft surface finish in underwater applications.

Diagram 05: Coefficient of friction as a function of the pressure, v = 0.01m/s
X = Load [MPa]
Y = Coefficient of friction µ
iglidur® UW
dry
Greases
Oil
Water
Coefficient of friction µ
0.15 - 0.35
0.09
0.04
0.04
Table 04: Coefficient of friction for iglidur® UW against steel
(Ra = 1µm, 50HRC)
Shaft materials
Diagrams 06 and 07 display an extract of the results of tests carried out with iglidur® UW plain bearings and different shaft materials. For rotating low loads, combinations of high grade steel and 304 stainless steel achieve the best coefficient of friction. The conditions shift with increasing loads. Please note that the wear rate increases significantly from loads >5MPa.


Consulting
I look forward to answering your questions
igus® (Pty) Ltd. +27 11 312 1848Write e-mail
Shipping and consultation
In person:
Monday to Friday from 7 am - 8 pm.
Saturdays from 8 am- 12 pm.
Online:
24h
WhatsApp-Service:
Montag – Freitag: 8 – 16 Uhr