Change Language :
iglidur® J3 - material data
The most important information at a glance
The new endurance runner: the specialist for pivoting and swelling loads.
iglidur J3 is directly comparable with our classic iglidur J in terms of general mechanical and thermal specifications
| Descriptive technical specifications | ||
|---|---|---|
| Wear resistance at +23°C | - 🟧 🟧 🟧 🟧 🟧 + | More information on wear resistance |
| Wear resistance at +90°C | - 🟧 🟧 🟧 🟧 🟧 + | |
| Wear resistance at +150°C | - 🟧 ⬜️ ⬜️ ⬜️ ⬜️ + | |
| Slide property | - 🟧 🟧 🟧 🟧 🟧 + | Coefficient of friction, dynamic, against steel: µ 0.06 - 0.20 |
| Wear resistance under water | - 🟧 🟧 🟧 🟧 ⬜️ + | |
| Media resistance | - 🟧 🟧 🟧 🟧 ⬜️ + | More information on media resistance |
| Resistant to edge pressures | - 🟧 🟧 🟧 🟧 ⬜️ + | |
| Resistant to shock and impact loads | - 🟧 🟧 🟧 🟧 ⬜️ + | |
| Dirt resistance | - 🟧 🟧 🟧 🟧 ⬜️ + |
Temperature
The temperatures prevailing in the bearing system also have an influence on bearing wear. Wear increases with rising temperatures, and the effect is particularly noticeable from a temperature of +90°C upwards. Additional protection is required at temperatures higher than +60°C.
Temperatures, coefficient of thermal expansion
| min. application temperature | Upper application temperature, long-term | Upper application temperature, short-term | In addition secure axially from |
|---|---|---|---|
| -50°C | +90°C | +120°C | +60°C |
Permissible surface speed
iglidur J3 is also suitable for medium to high speeds, whereby the limit values specified in the table can only be achieved with very low pressure loads. At the specified speeds, friction can lead to an increase up to the limit of the permanently permissible temperature. In practice, these limit values cannot always be achieved.
Surface speeds of different iglidur materials
| Maximum surface speed [m/s] | Rotating | Oscillating | linear |
|---|---|---|---|
| Long-term | 1.5 | 1.1 | 8.0 |
| Short-term | 3.0 | 2.1 | 10.0 |
Permissible pv values
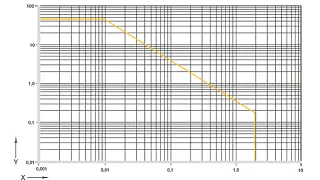
Diagram 01: Permissible pv values for iglidur J3 plain bearings with 1mm wall thickness in dry operation against a steel shaft, at +20°C, installed in a steel housing
X = surface speed [m/s]
Y = pressure [MPa]
Mechanical specifications
The maximum recommended surface pressure is a mechanical material parameter. Conclusions about the tribology cannot be drawn from this. The compressive strength of iglidur J3 plain bearings decreases with increasing temperatures. Diagram 02 illustrates this relationship. Diagram 03 shows the elastic deformation of iglidur J3 under radial load. Under the maximum recommended surface pressure of 45MPa, the deformation is less than 6%. Possible plastic deformation depends, among other things, on the duration of the impact.


Friction and wear
Like the wear resistance, the coefficient of friction μ also changes with the load and the surface speed (diagrams 04 and 05).
Coefficients of friction against steel (Ra = 1μm, 50 HRC):
| iglidur J3 | dry | Greases | Oil | Water |
|---|---|---|---|---|
| Coefficient of friction μ | 0.06 - 0.20 | 0.09 | 0.04 | 0.04 |


Shaft materials
Friction and wear are also highly dependent on the shaft material. Shafts that are too smooth increase both the coefficient of friction and the wear of the bearing. A ground surface with an average surface finish Ra = 0.1 - 0.3 μm is best suited for iglidur J3. Diagram 06 shows that iglidur J3 can be combined with many different shaft materials. Diagram 07 compares rotating and pivoting operation. It can be seen that with increasing load, the wear increases more with rotating than with pivoting movements.


Chemical resistance
iglidur J3 plain bearings are resistant to diluted alkalis and very weak acids as well as fuels and all types of lubricants. The low moisture absorption also allows them to be used in wet or damp environments. Plain bearings from iglidur J3 are resistant to numerous cleaning agents used in the food industry.
All data at room temperature [+20 °C], + resistant 0 conditionally resistant - non-resistant
| Chemicals | Resistance |
|---|---|
| Alcohols | + |
| Greases, oils without additives | + |
| Hydrocarbons | + |
| Fuels | + |
| Strong alkalines | + up to 0 |
| Strong acids | - |
| Diluted alkalines | + |
| Diluted acids | 0 to - |
Moisture absorption

Installation tolerances
iglidur J3 plain bearings are standard bearings for shafts with h-tolerance (recommended minimum h9). The bearings are designed for press-fit into a housing machined to a H7 tolerance. After being assembled into a nominal size housing, the inner diameter automatically adjusts to the E10 tolerances. In relation to the installation tolerance, the inner diameter changes with the absorption of humidity.
Important tolerances according to ISO 3547-1 after press-fit:
| Diameter d1 [mm] | Housing H7 [mm] | iglidur J3 plain bearing E10 [mm] | Shaft h9 [mm] |
|---|---|---|---|
| up to 3 | +0.000 +0.010 | +0.014 +0.054 | -0.025 +0.000 |
| > 3 up to 6 | +0.000 +0.012 | +0.020 +0.068 | -0.030 +0.000 |
| > 6 up to 10 | +0.000 +0.015 | +0.025 +0.083 | -0.036 +0.000 |
| > 10 up to 18 | +0.000 +0.018 | +0.032 +0.102 | -0.043 +0.000 |
| > 18 up to 30 | +0.000 +0.021 | +0.040 +0.124 | -0.052 +0.000 |
| > 30 up to 50 | +0.000 +0.025 | +0.050 +0.150 | -0.062 +0.000 |
| >50 to 80 | +0.000 +0.030 | +0.060 +0.180 | -0.074 +0.000 |
| >80 to 120 | +0.000 +0.035 | +0.072 +0.212 | -0.087 +0.000 |
| > 120 up to 180 | +0.000 +0.040 | +0.085 +0.245 | -0.100 +0.000 |
✓ 38 plastic bearings made from the most important iglidur materials
✓ Including iglidur J3 plain bearing
✓ Templates for finding the perfect material for your application
✓ iglidur bearing technology catalogue

Buy iglidur J3 products in the online shop
- Large selection of moulds and materials
- Available within 24 hours
- No minimum order value
- No minimum order quantity

Typical application areas


Consulting
I look forward to answering your questions
igus® (Pty) Ltd. +27 11 312 1848Write e-mail
Shipping and consultation
In person:
Monday to Friday from 7 am - 8 pm.
Saturdays from 8 am- 12 pm.
Online:
24h
WhatsApp-Service:
Montag – Freitag: 8 – 16 Uhr